Start with the big picture
Sales, orders, average order value, discount percentage and return rate sit together in the Overview. Monthly trends compare current sales with the prior year.
A two-page Power BI report connecting sales trends, product performance and returns—so the next question is easier to answer.
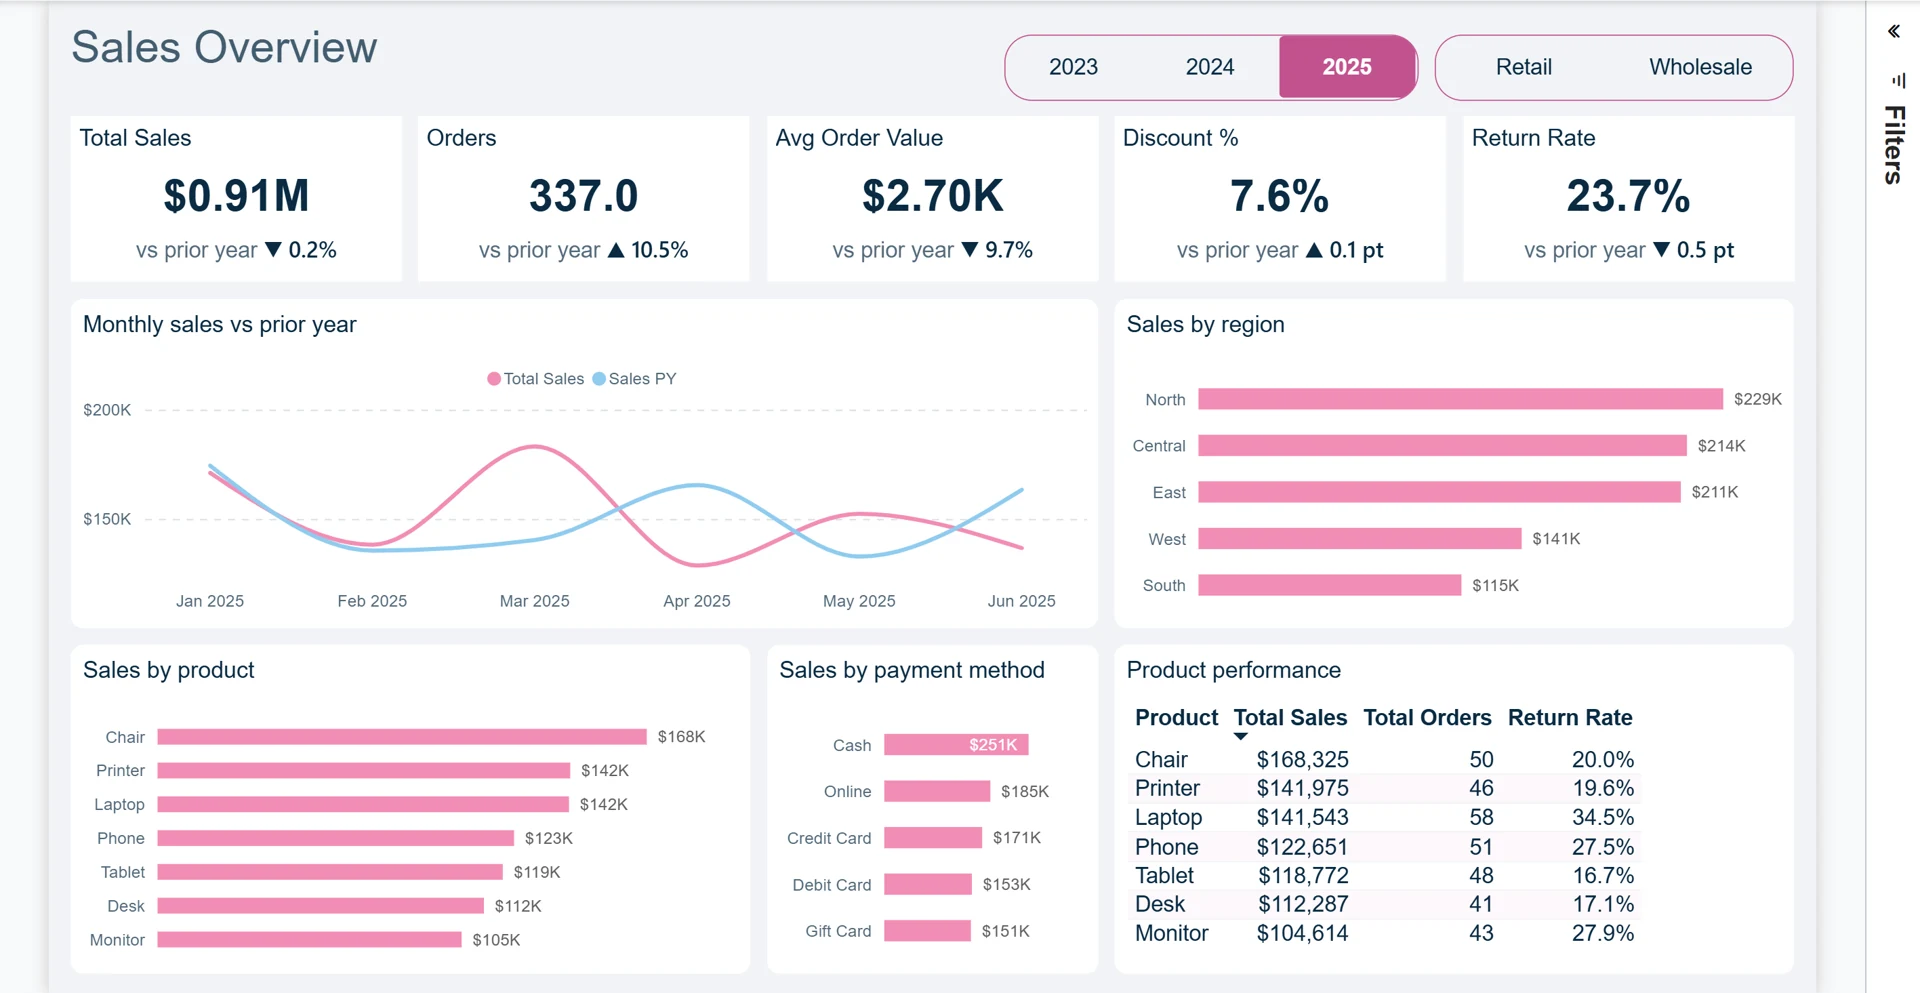
Sales totals only tell part of the story. A useful retail report also needs to show how products, regions, discounts and returns affect those totals—and make comparisons consistent when filters change.
I built a star schema with four fact tables and four shared dimensions, supported by 66 DAX measures organized in display folders. Power Query reads the source files through a single folder parameter. The report moves from an executive overview into product-level exploration.
Sales, orders, average order value, discount percentage and return rate sit together in the Overview. Monthly trends compare current sales with the prior year.
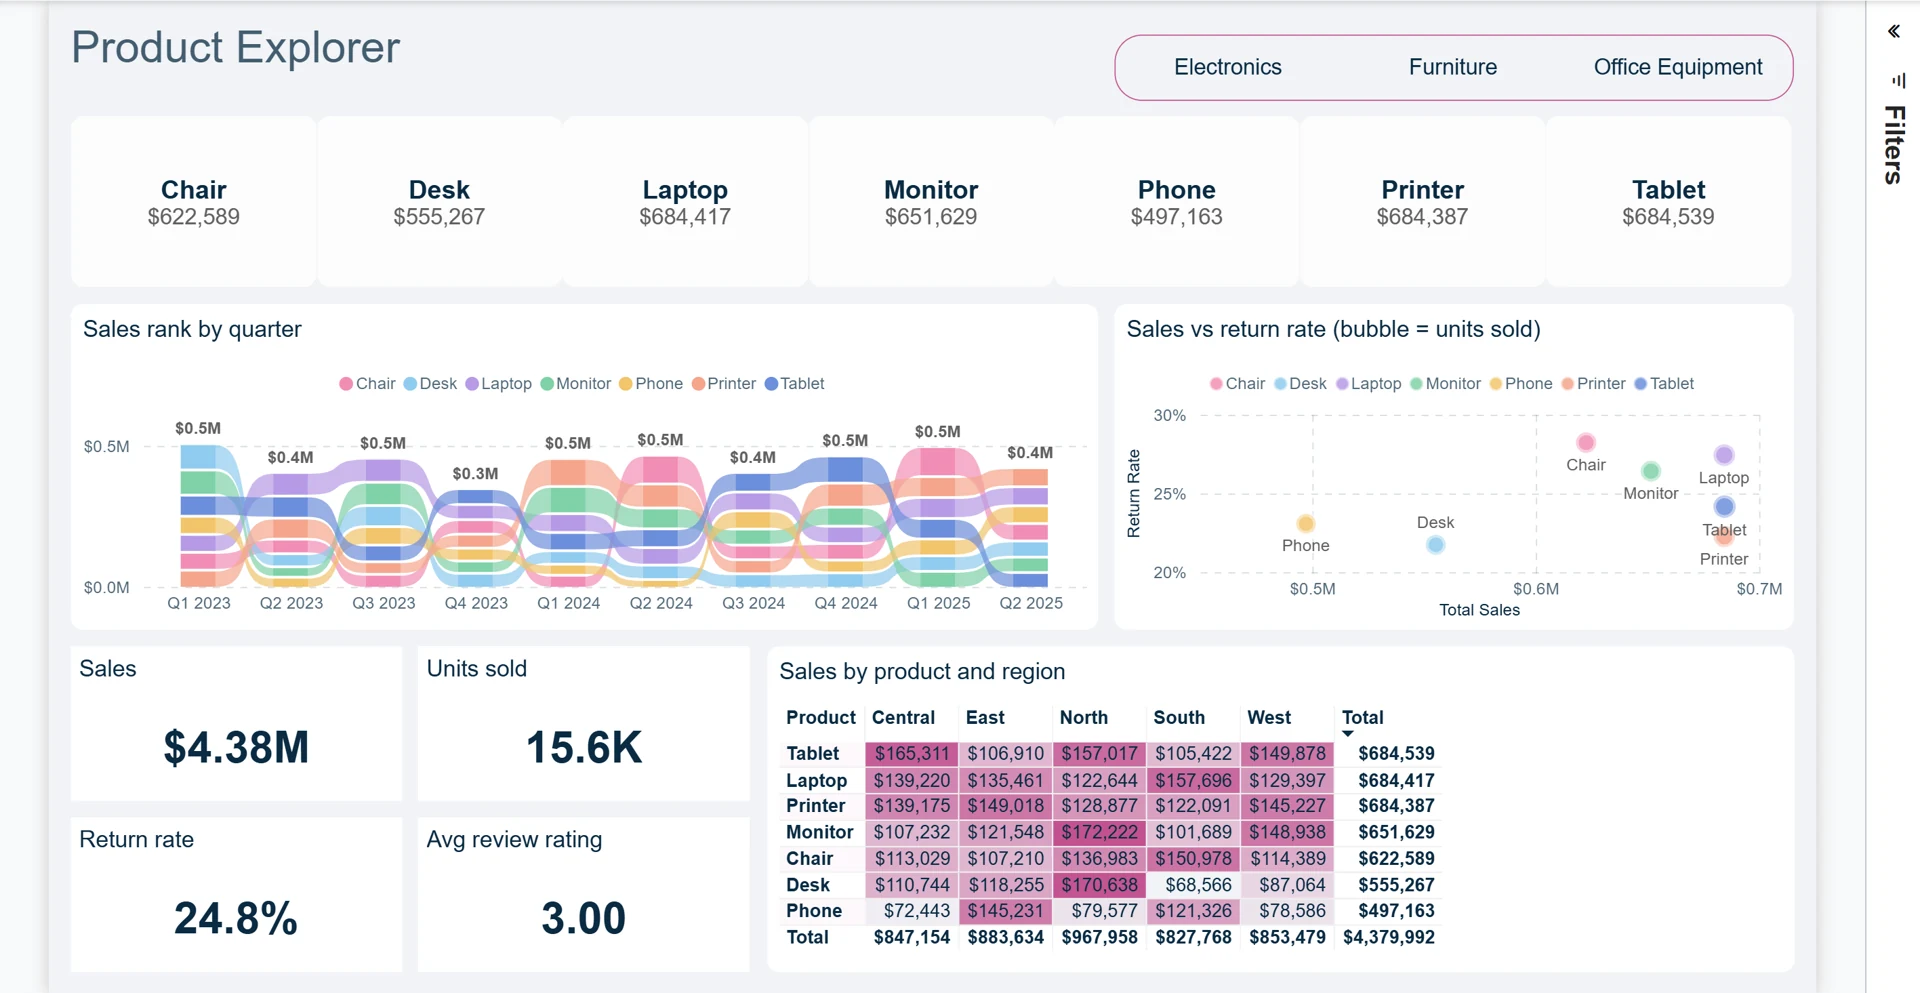
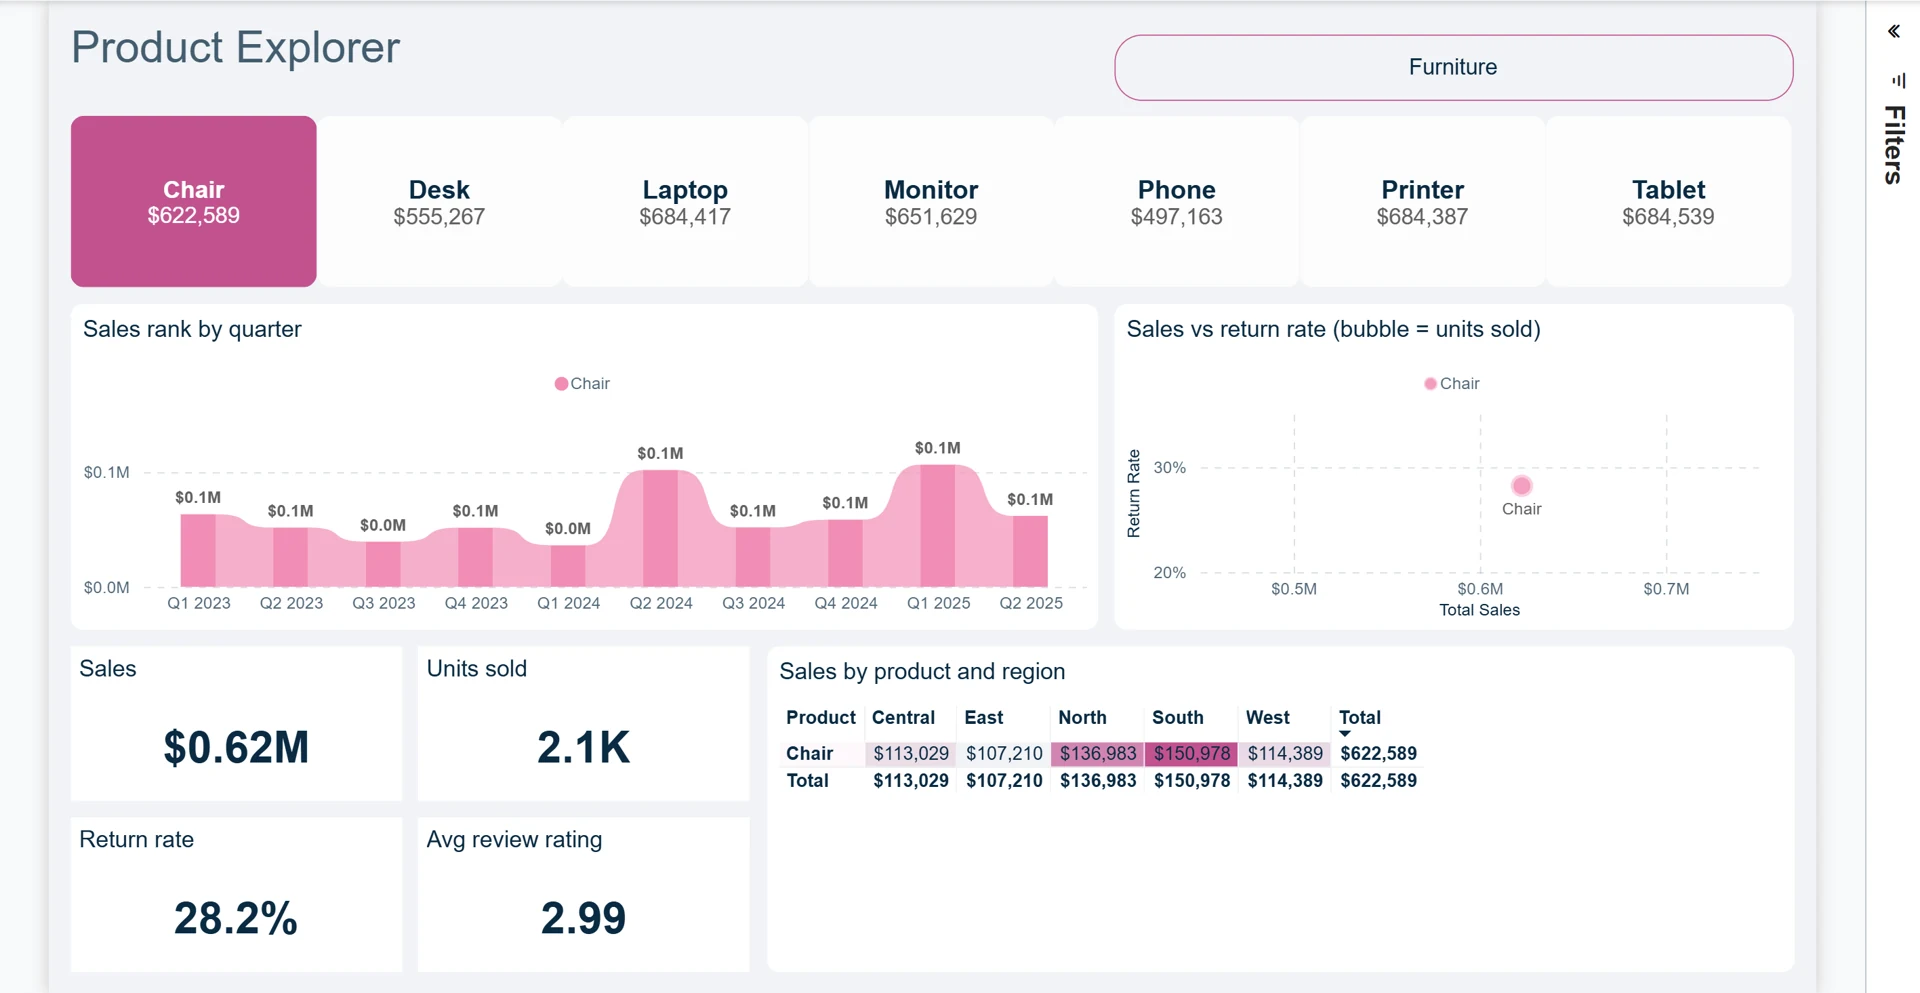
The Product Explorer combines category filters, quarterly sales rankings, a sales-versus-returns bubble chart and a product-by-region matrix.
Prior-year DAX measures require a single selected year, avoiding a misleading comparison across multiple years. Related measures cover YTD, month-over-month changes and selection-aware sales shares.
The result is an interactive reporting workflow: review the headline KPIs, identify a region or product worth investigating, then explore its sales and return patterns. Year and category filters help readers move from a broad overview to a focused question.
Open any screenshot to view it at full size.
See the report in action. Loading the walkthrough connects to LinkedIn.
Built with a public practice dataset. The figures illustrate the report’s analytical capabilities and are not client business results.
UP NEXT / 02
AdventureWorks Sales AnalysisA new dashboard, a reporting bottleneck, or data that needs a clearer story. Tell me what you’re working on.
omarmagdy99860@gmail.comCairo, Egypt · Working remotely with clients worldwide
Looking for something similar for your business?
Discuss your project