Workforce overview
Headcount and termination indicators provide a starting point for understanding workforce composition.
A people analytics dashboard for exploring headcount, compensation, termination rates and departmental differences.
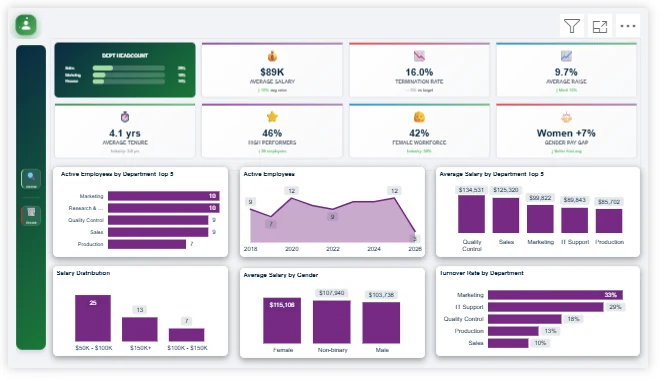
Workforce information becomes more useful when headcount, salary and termination patterns can be explored together. A clear report needs to help readers understand both the overall picture and departmental differences.
I used Power Query, DAX and Power BI to build a people analytics view covering workforce size, average salary, termination rates and gender pay comparisons, with department-level reporting.
Headcount and termination indicators provide a starting point for understanding workforce composition.
Average salary and gender pay comparisons help readers explore patterns that deserve further investigation.
The supporting PDF and video walkthrough make the work easier to review and understand.
The project provides a structured view of workforce and compensation patterns, supported by report documentation and a visual walkthrough. Readers can explore the overall workforce picture and the differences between departments.
Open any screenshot to view it at full size.
See the report in action. Loading the walkthrough connects to LinkedIn.
UP NEXT / 01
Sales & Retail AnalyticsA new dashboard, a reporting bottleneck, or data that needs a clearer story. Tell me what you’re working on.
omarmagdy99860@gmail.comCairo, Egypt · Working remotely with clients worldwide
Looking for something similar for your business?
Discuss your project